
You’ve seen the charts. A smooth, upward-sloping line showing German house prices almost quadrupling since the 1970s. Bankers, real estate agents, and Finanz-Fluencer (finance influencers) wave these graphs around like proof that buying property in Germany is the surest path to wealth. “Look”, they say, “prices only go up. It’s the safe, stable investment.”
That line of thinking is more fiction than fact. It’s built on data that’s systematically misleading you.
Gerd Kommer, the sharpest critic of conventional German investment wisdom, has laid out the case in devastating detail. Those official house price indices everyone loves to quote? They’re not just slightly off, they’re structurally designed to understate risk and inflate returns. Here’s why that matters for anyone living in Germany.
The Inflation Trap: How 5x Returns Become 0.1% Reality
Let’s start with the simplest trick in the book. When a bank or Makler (real estate agent) shows you a chart like the one above, they’re showing you nominal prices, raw numbers that include inflation. And German inflation has averaged about 2.7% per year over the last five decades.
Strip out inflation, and the picture transforms completely. According to Kommer’s analysis of Bank for International Settlements data, German residential real estate prices adjusted for inflation grew by a paltry 0.1% per year between 1970 and 2025. Not 0.1% above inflation. Literally 0.1% total. Over 56 years, a typical German Wohnung (apartment) gained just 9% in real terms. That barely covers the Nebenkosten (incidental purchase costs) you paid to buy and sell the thing.
A friend once told me they felt brilliant for buying in 1995. “My apartment has doubled in value!” They weren’t entirely wrong about the nominal number. But after inflation? They’d barely broken even. The pride was based on an illusion.
And that’s before we even talk about the costs you actually pay.
The Hidden Costs the Charts Never Show
House price indices track market values. They don’t track what you spend to own the place. And that gap is enormous in Germany.
Transaction costs in Germany are brutal. We’re talking roughly 10% for a complete round trip (buy and sell), thanks to Grunderwerbsteuer (property transfer tax), Makler (agent) fees, Notar (notary) costs, and Grundbuch (land register) entry fees. Spread over a typical 20-year holding period, that’s about 0.5% per year eaten before you start.
But the real killer is the ongoing costs. Maintenance, insurance, Grundsteuer (property tax), Kommer estimates these run about 1.5% of the property’s market value annually. That’s not a guess, it’s based on decades of real-world data he details in his analysis of maintenance costs.
Calculate that out. A €500,000 apartment costs you about €7,500 per year in maintenance and running expenses alone. That’s money you’re spending, not earning, and no index captures it.
Compare that to an Aktienindex (stock index), where companies’ maintenance costs are already baked into the returns. The difference in transparency is staggering.
The Quality Upgrade Con: You’re Actually Buying Improvements
Here’s a subtler deception. When you look at price increases over decades, you’re not just seeing market appreciation. You’re also paying for massive quality improvements to the properties themselves.
Think about it. A typical two-bedroom apartment in 1970s Germany had about 50 square meters. Today’s standard is closer to 65 square meters, a 30% increase in living space. Modern buildings have better insulation, double-glazed windows, elevators, balcony additions, photovoltaic systems, heat pumps.
These are genuine improvements to the property. But they’re improvements that cost money to make, and they show up in the index as pure price appreciation.
Academic research cited by Kommer estimates this quality effect inflates historical index returns by about 1.5% per year before 2000, and probably 0.5% annually even in recent decades. Over 20 years, that’s a 35% cumulative “fake” value gain that’s really just you paying for your own upgrades.
One Munich-area resident I know bought a 1960s Mehrfamilienhaus (multi-family building), spent €80,000 adding a lift, and congratulated himself when the valuation increased accordingly. The index would suggest it was market appreciation. The reality was he bought growth with cash.
The Volatility Cover-Up: Why Real Estate Looks Safe When It’s Not
This might be the most dangerous deception of all.
Go look at a chart comparing the MSCI Germany stock index to the German house price index. The stock index looks like a roller coaster, sharp drops, dramatic recoveries. The house price index looks like a gentle, pleasant walk in the Englischer Garten (English Garden).
The stock index has a volatility (annualized standard deviation) of about 18%. The house price index shows about 4-5%. That difference is marketed as proof that real estate is “safer.”
It’s almost entirely fake.
Houses aren’t priced daily like stocks. A typical German home changes hands every 10-20 years. Between transactions, valuations come from occasional Gutachten (appraisals) that intentionally avoid producing a current market price. As Kommer explains, these appraisals aim for a “sustainable long-term value” that smooths out short-term fluctuations on purpose.
The US finance industry has a sardonic name for this: “Volatility Laundering.” It’s the practice of using smoothed data to make illiquid assets look less risky than they really are.
The real volatility of real estate? Look at publicly traded German housing companies like Vonovia. Their stock price shows a volatility of about 28%, nearly double the MSCI World. Those are actual market prices for actual real estate holdings, with daily trading.
Every country in the developed world has seen real house prices drop by at least 30% at some point in the last 50 years. During the 2008 US crash, 12 million households lost 100% of their equity. That’s not the picture the index paints.
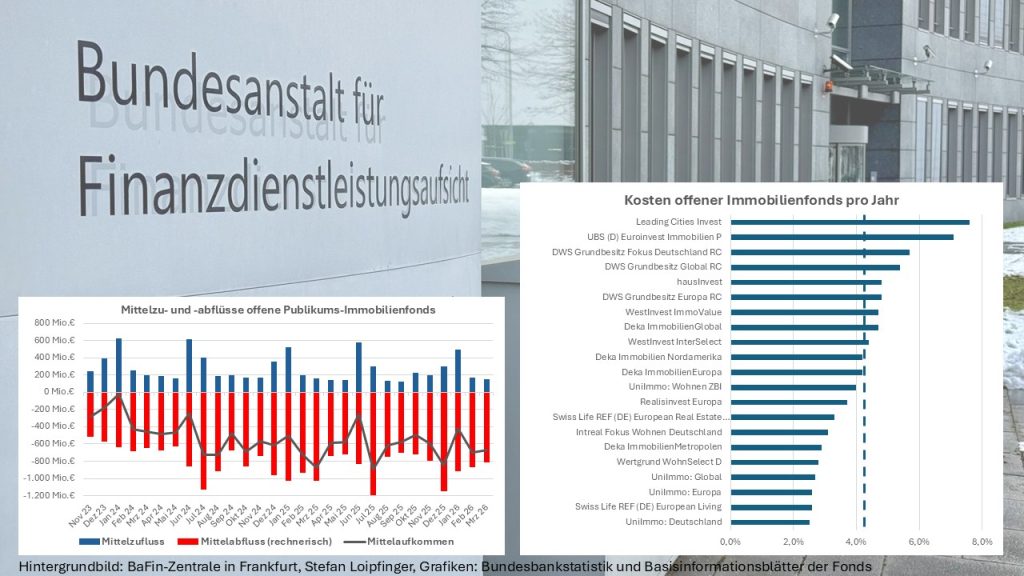
The BaFin (German financial regulator) is finally waking up to this problem, particularly with Offene Immobilienfonds (open-ended real estate funds) that market themselves with absurd risk indicators of 1 or 2 out of 7, suggesting they’re safer than government bonds. It’s a distortion that’s persisted for decades because the industry has no incentive to fix it.
The Diversification Mirage
Here’s the final structural lie: an index diversifies across thousands of properties. You probably own one.
A house price index pools the price movements of hundreds of thousands of homes across Germany. That smooths out individual property risk, location risk, Renovierungsstau (deferred maintenance) risk, and Mietausfall (rental vacancy) risk.
You, on the other hand, own a single Wohnung in Berlin-Neukölln or a Reihenhaus (terraced house) in some Speckgürtel (commuter belt) suburb. Your property has no diversification at all. Your risk is vastly higher than the index suggests.
With stocks, you can buy an ETF tracking the MSCI World and instantly own 1,300 global companies. You replicate the index. With real estate, the index doesn’t reflect your reality at all. You’re taking concentrated, idiosyncratic risk while the index shows diversified average performance.
Even Kommer’s critics, who argue that real estate can work well in specific high-demand areas like southern Germany’s booming regions, admit that local conditions make national indices meaningless for individual investors.
So What Should You Actually Do?
This isn’t a “real estate is always bad” argument. It’s a “the data you’re being sold is systematically rigged in the industry’s favor” argument.
Before you buy that beautiful Altbau (historic apartment) in Berlin or that Neubau (new construction) in the suburbs, adjust the numbers:
- Adjust for inflation. That 4% annual return becomes 1.3% real.
- Subtract transaction costs.
- Subtract 1.5% annual maintenance costs.
- Apply a generous reality check on quality improvements.
- Acknowledge your lack of diversification.
- Build in 30%+ potential volatility no one warned you about.
Plenty of people still come out ahead, especially with the leverage effect of mortgages. The DINK strategy of buying cheap property can work. So can buying in genuinely undersupplied markets that don’t follow national trends.
But don’t buy because “prices always go up” or “it’s the safest investment.” Those statements aren’t supported by the actual data. They’re supported by indices designed by people who profit when you believe them.
The next time someone shows you a house price chart at a cocktail party or in a bank meeting, ask them one question: “Is that inflation-adjusted?” Watch how fast the conversation changes.
Want to dive deeper into why many investors are exiting real estate for ETF portfolios? Or questioning whether the passive income myth holds up under scrutiny? The data might surprise you.