

Imagine you could hand one dollar to your great-great-great-great-grandparents in 1802 and tell them to invest it. Not in a startup. Not in a risky venture. Just put it in the market and sit on it through every war, depression, panic, and crisis for the next 221 years. By the end of 2023, what would that dollar be worth?
If they’d bought stocks: roughly $1.5 million (adjusted for inflation).
If they’d bought gold: about $120.
If they’d stuffed it in a mattress: around 6 cents.
Let that sink in for a moment. That dollar invested in equities outperformed gold by a factor of roughly 12,500 to 1. And cash? Cash was a wealth incinerator, quietly burning away 94% of its value over two centuries of inflation.
This comes from Paul McCaffrey’s 2025 study “Stocks for the long run – new evidence, old debates”, which extends Jeremy Siegel’s legendary research from 1998. The data covers everything from the Napoleonic Wars to COVID-19, and the verdict is remarkably consistent: when you’re playing the long game, equities win. They don’t just win. They dominate.
But here’s where it gets interesting, and a little spicy for the gold bugs out there.
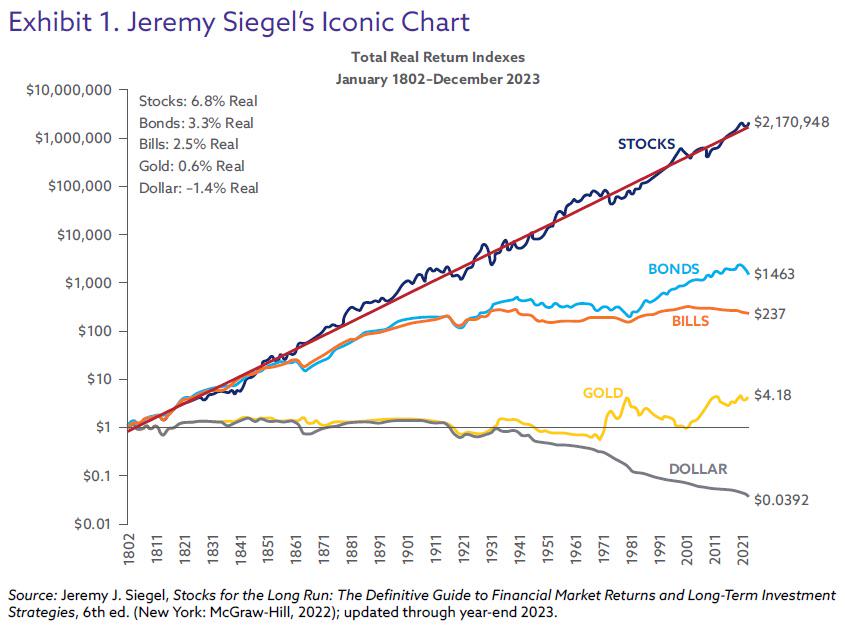
The Logarithmic Illusion: Why Your Eyes Are Lying to You
Before we dive deeper, let’s address the elephant in the chart. Anyone who’s seen the original comparison graph might think, “Stocks look great, but gold doesn’t look that bad either.” That’s because the data is plotted on a logarithmic scale, and plenty of viewers miss what that actually means.
On a log scale, equal distances represent equal percentage changes, not equal absolute amounts. So a move from $100 to $200 looks the same as a move from $1 million to $2 million. This visual compression makes the 1.5-million-dollar ending for stocks look like it’s sitting only a few “steps” above gold’s $120.
But here’s the reality: that visual gap represents a difference of five orders of magnitude. It took many viewers in the original discussion thread to point this out, with one commenter noting that without understanding the log scale, people “completely underestimate the discrepancies between the different graphs.” Translation: when you strip away the logarithmic smoothing and look at the raw numbers, gold’s performance relative to stocks is almost comically small.
So yes, the chart makes you feel like gold held its own. The math says otherwise.
The Gold-Dollar Elephant: A Legitimate Caveat
Now, before the gold crowd starts sharpening their pitchforks, let’s give credit where it’s due. The pre-1971 gold data comes with a serious asterisk.
Until the early 1970s, the US dollar was tied to gold under the Bretton Woods system. Gold had a fixed official price, essentially $35 per ounce for decades. The chart’s flat gold line through most of the 19th and 20th centuries doesn’t reflect free market dynamics. It reflects government price controls.
One commenter in the original discussion put it bluntly: “The gold-dollar peg was only dissolved in the early 1970s. Until then, gold couldn’t rise at all.” They argued that comparing asset classes across the full 220-year span is “worthless” and that only a comparison starting in 1971 would make sense.
This is a fair criticism, at least partially. Gold’s performance since the 1970s has been more robust, though the recent rally has been wilder than the charts suggest. From early 2024 through mid-2026, gold surged about 96%, roughly four times the DAX’s 23% gain during the same period.
But here’s the thing: even with that massive recent bull run, gold still can’t touch stocks over any meaningful multi-decade horizon. Why? Because gold doesn’t produce anything. It doesn’t pay dividends. It doesn’t grow earnings. It doesn’t have a P/E ratio. It just sits there, glittering, waiting for someone to pay a higher price for it.
The Shockingly Smooth Ride of Stocks
Let me show you something that surprised even seasoned investors in that original discussion: how remarkably stable the equity line appears over 220 years.

The Civil War? A tiny blip. The Great Depression? Hardly visible on the log scale. World War I and II? Minor wiggles. 2008’s financial crisis? A small pullback. COVID-19 and the crash that accompanied it? Virtually a straight line upward.
One commenter captured this sentiment perfectly: “I find it interesting that stocks are so constant. Corona, 2008, dot-com bubble, the 1929 crisis, the 1848 railway crisis, hardly visible. Even the world wars apparently had no major impact.”
This seems counterintuitive. 1929, for example, saw the Dow Jones collapse by about 90%. It took decades for investors to recoup their losses. How can the overall chart look so smooth?
The answer lies in the methodology and the magic of reinvestment. The study doesn’t track the Dow Jones Industrial Average. It tracks a broader, more representative collection of US equities, adjusted for reinvested dividends. When you include dividend reinvestment, the recovery from crashes accelerates dramatically. You’re not just waiting for the price to recover, you’re accumulating more shares at depressed prices, which supercharges your eventual recovery.
Also, the logarithmic scale is doing its quiet work again. A 50% crash looks visually identical whether it happens in 1929 or 2020. But the real impact on your long-term wealth is contextualized by how much you’d already accumulated and how quickly the market recovers.
What This Means for the German Investor
Now let’s bring this home. You’re reading this in Germany, probably with a Sparkasse account and perhaps a life insurance policy that’s been dragging your portfolio down for years. How should you feel about this 220-year dataset?
Here’s the uncomfortable truth: Germany’s favorite investment habits, Tagesgeldkonten (daily money accounts), Bausparverträge (savings contracts for building), and Lebensversicherungen (life insurance policies), have been quietly lagging behind what the global stock market has delivered for over a century.
The German banking system operates with the same efficiency as a Deutsche Bahn train: usually impeccable, until there’s construction on the line. And there’s always construction on the line with your returns when you park money in conservative products.
Consider this: the typical German sparplan (savings plan) contribution of €200 per month invested in a global equity ETF over 30 years could realistically generate a portfolio between €300,000 and €400,000 after inflation, assuming historical average returns. The same €200 monthly into a Sparkasse Sparbuch (savings book) at 0.5% interest? You’d end up with roughly €78,000 before inflation, which is likely to lose value in real terms.
That’s the difference between retiring comfortably and retiring worried about your Pension (German pension) keeping up with rent increases.
Why Gold Still Belongs in Your Portfolio (Just Not Your Core)
I’m not saying gold is worthless. For physical gold, the buying and selling process has real advantages, it’s tangible, it’s globally recognized, and it can provide a psychological anchor in times of panic. Many experts recommend it as 5-10% of a diversified portfolio.
But if you’re treating gold as your primary retirement vehicle, you’re fighting 220 years of data. And that fight rarely ends well.
Here’s the calculation that matters: Over the 220-year period, stocks delivered an annualized real return of roughly 6.8%. Gold? About 0.6%. That difference, compounded over decades, produces the massive wealth gap we see in the chart. Gold is a hedge, not a wealth builder.
The Real Lesson: Patience and Dividends
What should you take from this 220-year circus of tulip manias, railroad booms, world wars, and tech bubbles?
First, the stock market rewards the patient. If you’re investing with a 15-year time horizon or longer, equities have delivered positive real returns in virtually every historical period. Not every year, not every decade, but eventually.
Second, reinvested dividends are the engine of wealth. The study’s methodology reinvests dividends, and that’s exactly what happens if you let an ETF-Sparplan (ETF savings plan) run automatically. You don’t need to do anything fancy. Just keep buying, keep reinvesting, and let the power of compounding work overtime, something I’ve argued works even when you’re starting with limited funds.
Third, cash is a leaking bucket. You need some for emergencies, but hoarding it for retirement is financial self-sabotage.
What About the Spicy Question: Gold’s Recent Rally?
I can already hear the counter-arguments. “But gold has been on a massive run!” And you’re right, it has. The question is whether that recent performance changes the long-term calculus.
Recent commentary in the German financial press highlights that gold’s surge has been driven by geopolitical instability, central bank buying, and falling real interest rates, genuine factors that suggest gold retains value as a crisis hedge. But the 220-year data suggests something uncomfortable for gold enthusiasts: these runs tend to be cyclical and are often followed by decades of stagnation.
Gold’s record in Germany is particularly telling. From 1980 to 2000, gold lost roughly two-thirds of its value after adjusting for inflation. That’s a 20-year investment horizon that produced a catastrophic real loss. Stocks, by contrast, returned about 12% annually during the same period.
There’s a reason financial educators argue for teaching financial literacy in schools, the data has existed for decades, yet the average German savers’ asset allocation remains stubbornly conservative. That’s not a criticism of German savers, it’s a criticism of the advice they’ve received.
The Bottom Line: Keep It Simple
Here’s my kind-of-controversial take: you don’t need to be a financial genius to benefit from this data. You don’t need to pick winning stocks, time the market, or negotiate with the Finanzamt (tax office) to optimize every percentage point. You just need to do three things:
- Own broadly diversified global equities through something like an MSCI World or FTSE All-World ETF-Sparplan (savings plan), which, as the current German retirement price war shows, is getting cheaper every month.
- Keep reinvesting dividends automatically.
- Wait. That’s it. Just wait.
Warren Buffett talks about the stock market as a transfer of wealth from the impatient to the patient. This 220-year study is the definitive proof. The patient got $1.5 million. The impatient got gold bars.
And if you’re tempted to blow your investment budget on six vacations a year instead of funding your retirement, well, the math is doing what the math always does. It’s waiting quietly, compounding in the background, while you decide what kind of retirement you want.
The dollar invested in 1802 didn’t require genius. It required patience. And that’s an asset class we all have access to.